Immigrant Visa Waiting Lists
Annual Report of Immigrant Visa Applicants in the Family-sponsored and Employment-based preferences Registered at the National Visa Center as of November 1, 2018
Most prospective immigrant visa applicants qualify for status under the law on the basis of family relationships or employer sponsorship. Entitlement to visa processing in these classes is established ordinarily through approval by U.S. Citizenship and Immigration Services (USCIS) of a petition filed on the applicant’s behalf. The petitions of applicants who will be processed at an overseas post are forwarded by USCIS to the Department of State; applicants in categories subject to numerical limit are registered on the visa waiting list. Each case is assigned a priority (i.e., registration) date based on the filing date accorded to the petition. Visa issuance within each numerically limited category is possible only if the applicant’s priority date is within the applicable final action dates which are published each month by the Department of State in the Visa Bulletin. Family and Employment preference applicants compete for visa numbers within their respective categories on a worldwide basis according to priority date; a per-country limit on such preference immigrants set by INA 202 places a maximum on the amount of visas which may be issued in a single year to applicants from any one country, however.
In October, the Department of State asked the National Visa Center (NVC) at Portsmouth, New Hampshire to report the totals of applicants on the waiting list in the various numerically-limited immigrant categories. Applications for adjustment of status under INA 245 which are pending at USCIS Offices are not included in the tabulation of the immigrant waiting list data which is being provided at this time. As such, the following figures ONLY reflect petitions which the Department of State has received, and do not include the significant number of applications held with the USCIS Offices.
The following figures have been compiled from the NVC report submitted to the Department on November 1, 2018, and show the number of immigrant visa applicants on the waiting list in the various preferences and subcategories subject to numerical limit. All figures reflect persons registered under each respective numerical limitation, i.e., the totals represent not only principal applicants or petition beneficiaries, but their spouses and children entitled to derivative status under INA 203(d) as well.
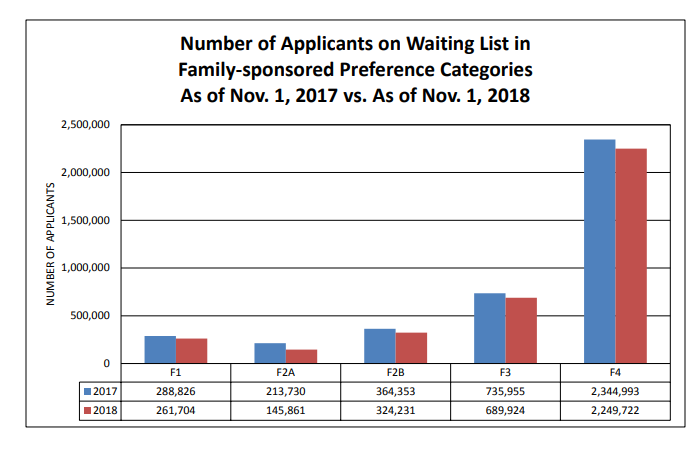
Family-sponsored Preferences
| Category | as of Nov 1, 2017 | as of Nov 1, 2018 | % of Change from 2017 Totals |
|---|---|---|---|
| FAMILY FIRST | 288,826 | 261,704 | (-9.4%) |
| FAMILY SECOND TOTAL | 578,083 | 470,092 | (-18.7%) |
| 2A-Spouses/Children: | 213,730 | 145,861 | (-31.8%) |
| 2B-Adult Sons/Daughters: | 364,353 | 324,231 | (-11.0%) |
| FAMILY THIRD | 735,955 | 689,924 | (-6.3%) |
| FAMILY FOURTH | 2,344,993 | 2,249,722 | (-4.1%) |
| TOTAL | 3,947,857 | 3,671,442 | (-7.0%) |
(click image for full size chart)
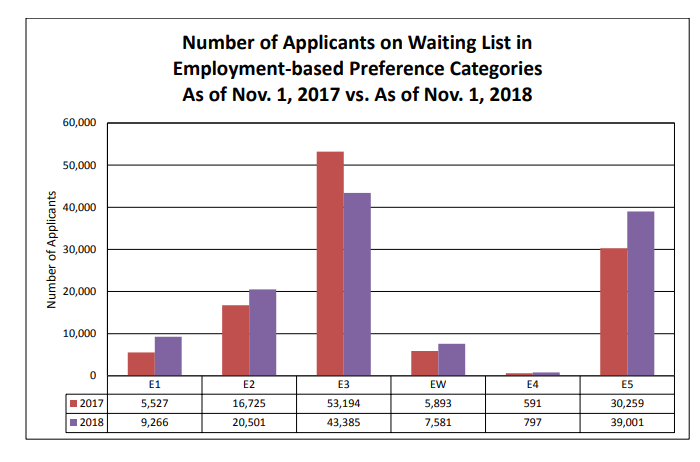
Employment-based Preferences
| Category | as of Nov 1, 2017 | as of Nov 1, 2018 | % of Change from 2017 Totals |
|---|---|---|---|
| EMPLOYMENT FIRST | 5,527 | 9,266261,704 | (+67.6%) |
| EMPLOYMENT SECOND | 16,725 | 20,501 | (+22.6%) |
| EMPLOYMENT THIRD TOTAL | 59,087 | 50,966 | (-13.7%) |
| Skilled Workers: | 53,194 | 43,385 | (-18.4%) |
| Other Workers: | 5,893 | 7,581 | (+28.6%) |
| EMPLOYMENT FOURTH TOTAL | 591 | 797 | (+34.9%) |
| EMPLOYMENT FIFTH TOTAL | 30,259 | 39,001 | (+28.9%) |
| TOTAL | 112,189 | 120.531 | (+7.4%) |
| GRAND TOTAL | 4,060,046 | 3,791,973 | (-6.6%) |
(click image for full size chart)
Immigrant Waiting List By Country
Immigrant visa issuances during fiscal year 2019 will be limited by the terms of INA 201 to no more than 226,000 in the family-sponsored preferences and approximately 140,000 in the employment-based preferences. (Visas for “Immediate Relatives” – i.e., spouses, unmarried children under the age of 21 years, and parents of U.S. citizens – are not subject to numerical limitation, however.)
It should by no means be assumed that once an applicant is registered, the case is then continually included in the waiting list totals unless and until a visa is issued. The consular procedures mandate a regular culling of visa cases to remove from the count those unlikely to see further action, so that totals are not unreasonably inflated.
The eleven countries with the highest number of waiting list registrants in FY 2019 are listed below; together these represent 77.8% of the total. This list includes all countries with at least 55,000 persons on the waiting list. There is a seven percent per-country limit, which visa issuances to any single country may not exceed. This limit serves to avoid the potential monopolization of virtually all the annual limitation by applicants from only a few countries. That limitation is not a quota to which any particular country is entitled, however. For FY 2019 the per-country limit will be approximately 25,620.
| Country | Applicants |
|---|---|
| Mexico | 1,229,505 |
| Philippines | 314,229 |
| India | 298,571 |
| Vietnam | 231,519 |
| China-mainland born | 231,519 |
| Bangladesh | 169,231 |
| Dominican Republic | 146,160 |
| Pakistan | 115,625 |
| Haiti | 94,506 |
| El Salvador | 64,868 |
| Cuba | 55,847 |
| All Others | 840,393 |
| Worldwide Total | 3,791,973 |
Immigrant Waiting List By Preference Category
FAMILY-SPONSORED PREFERENCES
Family FIRST Preference:
The worldwide Family FIRST preference numerical limitation is 23,400. The top ten countries with the highest F1 waiting list totals are:
| Country | Family First Preference Total | Percent of Category Waiting List |
|---|---|---|
| Mexico | 104,251 | 39.8% |
| Dominican Republic | 21,294 | 8.1% |
| Philippines | 17,535 | 6.7% |
| Haiti | 13,814 | 5.3% |
| Jamaica | 11,982 | 4.6% |
| El Salvador | 9,140 | 3.5% |
| Colombia | 4,627 | 1.8% |
| Vietnam | 4,579 | 1.7% |
| Honduras | 4,448 | 1.7% |
| Guyana | 4,078 | 1.6% |
| All Others | 65,956 | 25.2% |
| Total | 261,704 | 100% |
Cases are being added to the waiting list in this category not only by the approval of new FIRST preference petitions, but also through automatic conversion of pending 2B cases into FIRST preference upon the naturalization of the petitioner.
The prospect for increasing future demand in the FIRST preference could result in slower advances in the worldwide final action date as a consequence. Only two countries, Mexico and Philippines, have FIRST preference final action dates which are earlier than the worldwide date. (NOTE: A Family 2B petition automatically converts to a Family FIRST petition if the petitioner naturalizes. However, Section 6 of the Child Status Protection Act of 2002, Pub. L. 107-208, provides relief for Family 2B applicants who would be disadvantaged by a conversion to Family FIRST status due to a less favorable Family FIRST final action date).
Family SECOND Preference:
The total Family SECOND preference waiting list figure is 470,092. Of these, 145,861 (31%) are spouses and children of permanent residents of the United States (the 2A class), and 324,231 (69%) are adult unmarried sons/daughters of permanent residents (the 2B class). The Family SECOND preference represents 12.8% of the total Family preference waiting list. It will receive 114,200 visa numbers for FY 2019, just over half of the 226,000 family preference total; 77% of SECOND preference numbers are provided to 2A applicants, while the remaining 23% go to the 2B class.
2A: About 87,900 visa numbers are available for use during FY 2019. The top ten countries with the highest 2A waiting list totals are:
| Country | Family 2A Preference Total | Percent of Category Waiting List |
|---|---|---|
| Mexico | 51,407 | 35.2% |
| Dominican Republic | 15,985 | 11% |
| Cuba | 13,868 | 9.5% |
| El Salvador | 6,898 | 4.7% |
| Philippines | 4,721 | 3.2% |
| Haiti | 4,053 | 2.8% |
| Guatemala | 4,015 | 2.8% |
| China-mainland born | 3,817 | 2.6% |
| Honduras | 3,434 | 2.4% |
| Vietnam | 3,336 | 2.3% |
| All Others | 34,327 | 23.5% |
| TOTAL | 145,861 | 100% |
Upon naturalization of the petitioner, a pending 2A case is converted automatically into the “Immediate Relative” visa category, which is not subject to numerical limit and therefore has no visa waiting period. As a result, the amount of cases being processed in the “Immediate Relative” category may increase and partially offset new F2A filings.
2B: Visa numbers for this class of adult sons and daughters will be approximately 26,260 during FY 2019. The waiting list far exceeds the annual limit. The top ten countries with the highest 2B waiting list totals are:
| Country | Family 2B Preference Total | Percent of Category Waiting List |
|---|---|---|
| Mexico | 139,673 | 43.1% |
| Philippines | 46,646 | 14.4% |
| Dominican Republic | 35,294 | 10.9% |
| Haiti | 13,419 | 4.1% |
| El Salvador | 9,187 | 2.8% |
| Vietnam | 8,671 | 2.7% |
| Cuba | 8,303 | 2.6% |
| China-mainland born | 6,694 | 2.1% |
| Guatemala | 3,992 | 1.2% |
| Jamaica | 3,974 | 1.2% |
| All Others | 48,378 | 14.9% |
| TOTAL | 324,231 | 100% |
Some of the 2B applicants were formerly counted in the 2A waiting list and have since turned 21.
Family THIRD Preference:
The annual visa limit is 23,400. Two oversubscribed countries (Mexico and Philippines) have sufficiently heavy demand in this preference to require a final action date substantially earlier than the worldwide date. The top ten countries with the highest F3 waiting list totals are:
| Country | Family Third Preference Total | Percent of Category Waiting List |
|---|---|---|
| Mexico | 205,277 | 29.8% |
| Philippines | 119,315 | 17.3% |
| India | 45,892 | 6.6% |
| Vietnam | 39,249 | 5.7% |
| China-mainland born | 20,397 | 3.0% |
| Dominican Republic | 15,780 | 2.3% |
| Haiti | 15,538 | 2.2% |
| Pakistan | 14,129 | 2.0% |
| Cuba | 12,235 | 1.8% |
| El Salvador | 10,971 | 1.6% |
| All Others | 191,141 | 27.7% |
| TOTAL | 689,924 | 100% |
Family FOURTH Preference:
Applicants registered in the Family FOURTH preference total 2,249,722. Annual visa issuances are limited to 65,000. The waiting period for the Family FOURTH preference is longer than any other category because the demand significantly exceeds the number of available visas. The countries listed below have the largest number of FOURTH preference applicants:
| Country | Family Fourth Preference Total | Percent of Category Waiting List |
|---|---|---|
| Mexico | 727,289 | 32.3% |
| India | 210,863 | 9.4% |
| Vietnam | 173,086 | 7.7% |
| Bangladesh | 160,345 | 7.1% |
| China-mainland born | 153,106 | 6.8% |
| Philippines | 113,489 | 5.0% |
| Pakistan | 97,249 | 4.3% |
| Dominican Republic | 57,737 | 2.6% |
| Haiti | 47,660 | 2.1% |
| El Salvador | 28,460 | 1.3% |
| All Others | 480,438 | 21.4% |
| TOTAL | 2,249,722 | 100% |
The steadily growing waiting period in this preference is now over thirteen years for countries of most favorable visa availability and even longer for some oversubscribed countries.
EMPLOYMENT-BASED PREFERENCES
It is important to note that eighty percent of all Employment preference immigrants were processed as adjustment of status cases at USCIS offices during FY 2018. Cases pending with USCIS are not counted in the consular waiting list tally which is presented below. Therefore, in several Employment categories the waiting list totals being provided below significantly understate real immigrant demand. The Employment waiting list counts not only prospective workers, but also their spouses and children entitled under the law to derivative preference status.
Employment FIRST Preference:
Top countries are:
| Country | Employment First Preference | Percent of Category Waiting List |
|---|---|---|
| China-mainland born | 4,513 | 48.7% |
| India | 876 | 9.4% |
| Great Britain and Northern Ireland | 393 | 4.2% |
| Korea, South | 358 | 3.9% |
| Canada | 357 | 3.8% |
| Brazil | 321 | 3.5% |
| Venezuela | 285 | 3.1% |
| Iran | 173 | 1.9% |
| France | 138 | 1.5% |
| Germany | 112 | 1.2% |
| All Others | 1,740 | 18.8% |
| WORLDWIDE TOTAL | 9,266 | 100% |
A Final Action Date is established at present for all countries.
Employment SECOND Preference:
Top countries are:
| Country | Employment Second Preference | Percent of Category Waiting List |
|---|---|---|
| India | 13,387 | 65.3% |
| China-mainland born | 2,479 | 12.1% |
| Korea, South | 1,526 | 7.4% |
| Philippines | 367 | 1.8% |
| Canada | 333 | 1.6% |
| All Others | 2,409 | 11.8% |
| WORLDWIDE TOTAL | 20,501 | 100% |
This category is “current” at present for all but two countries.
Employment THIRD Preference:
Top countries are:
| Country | Employment Third Preference: Skilled Worker / Professional Components |
Percent of Category Waiting List |
|---|---|---|
| India | 21,385 | 49.3% |
| Philippines | 11,149 | 25.7% |
| China-mainland born | 2,122 | 4.9% |
| Korea, South | 817 | 1.9% |
| United Arab Emirates | 628 | 1.4% |
| All Others | 7,284 | 16.8% |
| WORLDWIDE TOTAL | 43,385 | 100% |
Employment Third “Other Workers”:
Top Countries are:
| Country | Employment Third Preference: Other Worker Components |
Percent of Category Waiting List in These Classes |
|---|---|---|
| China-mainland born | 2,128 | 28.1% |
| Philippines | 971 | 12.8% |
| Vietnam | 920 | 12.1% |
| Mexico | 712 | 9.4% |
| Korea, South | 674 | 8.9% |
| All Others | 2,176 | 28.7% |
| WORLDWIDE TOTAL | 7,581 | 100% |
Three oversubscribed countries (China-mainland born, India, and the Philippines) have sufficiently heavy demand in the Employment Third and Third “Other Worker” Preferences to require final action dates earlier than the worldwide dates.
Employment FOURTH Preference:
Top countries are:
| Country | Employment Fourth Preference | Percent of Category Waiting List in These Classes |
|---|---|---|
| India | 235 | 29.5% |
| Mexico | 68 | 8.5% |
| Brazil | 41 | 5.1% |
| Guatemala | 34 | 4.3% |
| Israel | 31 | 3.9% |
| All Others | 388 | 48.7% |
| WORLDWIDE TOTAL | 797 | 100% |
The above Employment Fourth Preference category totals include the SR category. Visa availability is “current” at present for all countries except for El Salvador, Guatemala, Honduras, and Mexico.
Employment FIFTH Preference:
Top countries are:
| Country | Employment Fifth Preference | Percent of Category Waiting List in These Classes |
|---|---|---|
| China-mainland born | 33,957 | 87.1% |
| Vietnam | 1,524 | 3.9% |
| India | 541 | 1.4% |
| Korea, South | 448 | 1.2% |
| Hong Kong S.A.R. | 329 | 0.8% |
| All Others | 2,202 | 5.6% |
| WORLDWIDE TOTAL | 39,001 | 100% |
Visa availability is “current” at present for all countries except China-mainland born and Vietnam.
Family-sponsored Immigrant Waiting List By Country
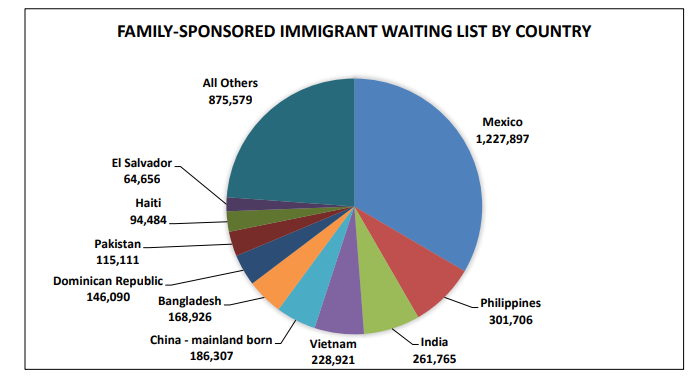
The ten countries with the highest number of Family-sponsored waiting list registrants are listed below; together these represent 76.2% of the total. This list includes all countries with at least 64,000 persons on the waiting list. (The per-country limit in INA 202 sets an annual maximum on the amount of Family preference visas which may be issued to applicants from any one country; the FY 2019 per-country limit will be 15,820.)
Family-sponsored Preferences
| Country | Total |
|---|---|
| Mexico | 1,227,897 |
| Philippines | 301,706 |
| India | 261,765 |
| Vietnam | 228,921 |
| China-mainland born | 186,307 |
| Bangladesh | 168,926 |
| Dominican Republic | 146,090 |
| Pakistan | 115,111 |
| Haiti | 94,484 |
| El Salvador | 64,656 |
| All Others | 875,579 |
| Worldwide Total | 3,671,442 |
(click image for full size chart)
Family-sponsored Immigrant Waiting List By Region
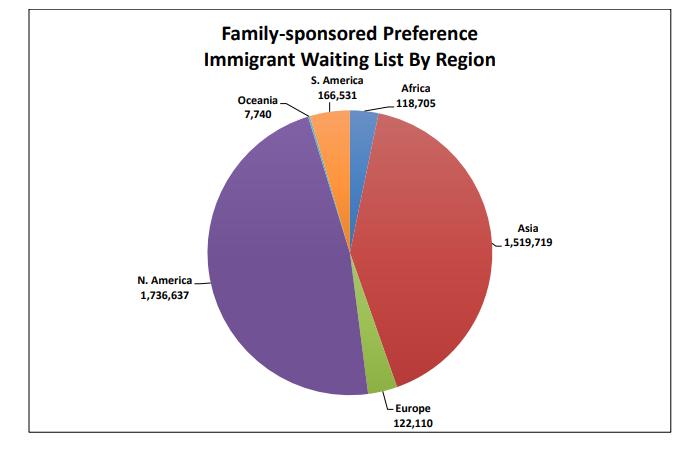
A breakdown of the NVC waiting list by region is:
| Region | Total |
|---|---|
| Africa | 118,705 |
| Asia | 1,519,719 |
| Europe | 122,110 |
| N. America* | 1,736,637 |
| Oceania | 7,740 |
| S. America | 166,531 |
| Family Total | 3,671,442 |
*North America includes Canada, Mexico, Central America and the Caribbean.
(click image for full size chart)
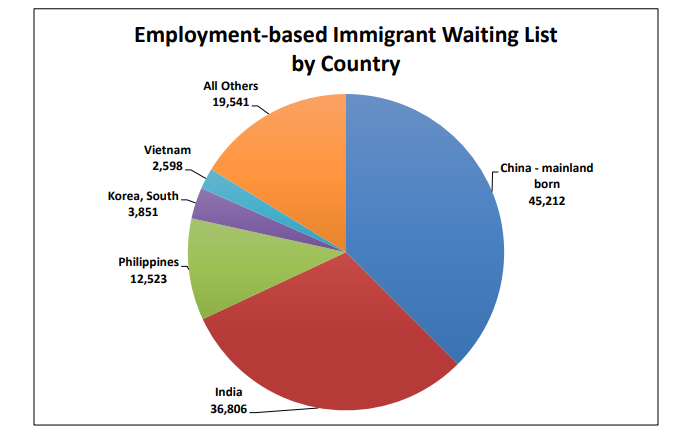
Employment-based Immigrant Waiting List By Country
The five countries with the highest number of Employment-based waiting list registrants are listed below; together these represent 83.8% of the total. This list includes all countries with at least 2,500 persons on the waiting list. (The per-country limit in INA 202 sets an annual maximum on the amount of Employment preference visas which may be issued to applicants from any one country; the FY 2019 per-country limit will be approximately 9,800.)
Employment-based Preferences
| Country | Total |
|---|---|
| China-mainland born | 45,212 |
| India | 36,806 |
| Philippines | 12,523 |
| Korea, South | 3,851 |
| Vietnam | 2,598 |
| All Others | 19,541 |
| Worldwide Total | 120,531 |
(click image for full size chart)
Employment-based Immigrant Waiting List By Region
A breakdown of the NVC waiting list by region is:
| Region | Total |
|---|---|
| Africa | 1,679 |
| Asia | 107,502 |
| Europe | 4,113 |
| N. America* | 4,012 |
| Oceania | 201 |
| S. America | 3,024 |
| Family Total | 120,531 |
*North America includes Canada, Mexico, Central America and the Caribbean.
(click image for full size chart)
THE TEXT ABOVE IS PUBLIC DOMAIN MATERIAL AUTHORED BY AN AGENCY OF THE UNITED STATES GOVERNMENT AND NOT COPYRIGHTED BY THIS WEBSITE. To locate the original material (which may have been updated) click here

